
好久沒有研究 Monitor 平台了,以前都是用 Cacti 打造就覺得這玩意高大上了,但是最近研究完 Grafana+Prometheus 才知道為什麼這個組合會變成最近的潮流,這實在是太炫了,比 Cacti 不知道好看多少倍。
但是也因為如此,所以花了不少時間研究一下如何將自己設定的參數值,透過 Prometheus 在 Grafana 顯示出來
Install
Install 我就不講太多了,網路上有很多文章,我這邊就迅速帶過一下我怎麼做的。
首先我因為測試的關係,所以我系統是跑在 Docker 上,關於 Docker 的文章也很多,我自己也是參照我自己的文件Build SDK in Docker
故不詳述。
有了 Docker 以後,記得開 Port 出來用,我的 run docker command 如下
其實不用 Forward 這麼多 Port 的,只是測試用所以就 Forward 一堆
$ docker run -d --privileged=true --name test3 -v /work:/work -p 40002:22 -p 80:80 -p 8080:8080 -p 9100:9100 -p 3000:3000 -p 9090:9090 -p 8000:8000 -P ubuntu1604Install Grafana command,主要是參照 Grafana Download ,當然你也可以跑一個 Docker image 起來,但是暫時我還沒有想這樣做,以下都假設已經有了 Docker 環境
$ wget https://dl.grafana.com/oss/release/grafana_5.4.3_amd64.deb
$ sudo dpkg -i grafana_5.4.3_amd64.deb
Prometheus Install
這邊要下載 Prometheus, node_explorer 和 Prometheus python client
$ wget https://github.com/prometheus/prometheus/releases/download/v2.7.1/prometheus-2.7.1.linux-amd64.tar.gz
$ wget https://github.com/prometheus/node_exporter/releases/download/v0.17.0/node_exporter-0.17.0.linux-amd64.tar.gz
$ apt install python3-pip
$ pip3 install prometheus_client
編輯 prometheus.yml
在 scrape_configs: 下新加上以下這一段,node_exporter 是預設跑在 9100,自己的程式跑在 8000
這時候還沒有跑到自己的程式沒有關係,等等會講到
  - job_name: 'Example'

    static_configs:
    - targets: ['localhost:9100']

  - job_name: 'pythontest'
    static_configs:
    - targets: ['localhost:8000']
分別執行 Prometheus 和 Node_explorer
$ ./prometheus
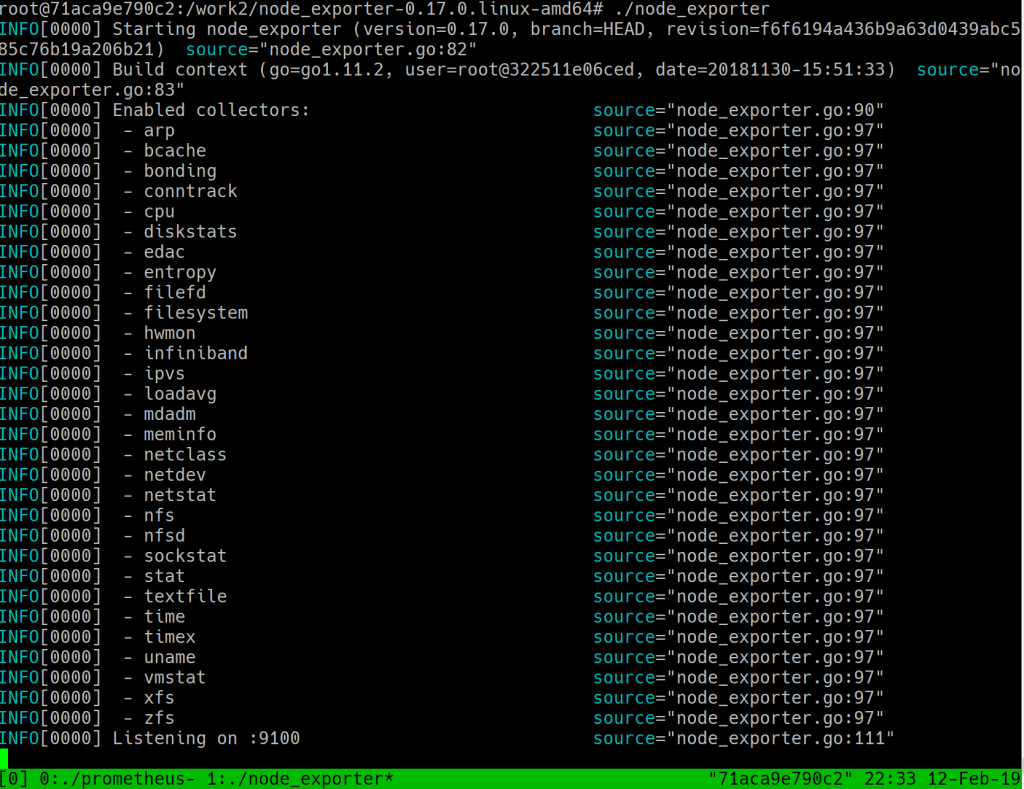
$ ./node_exporter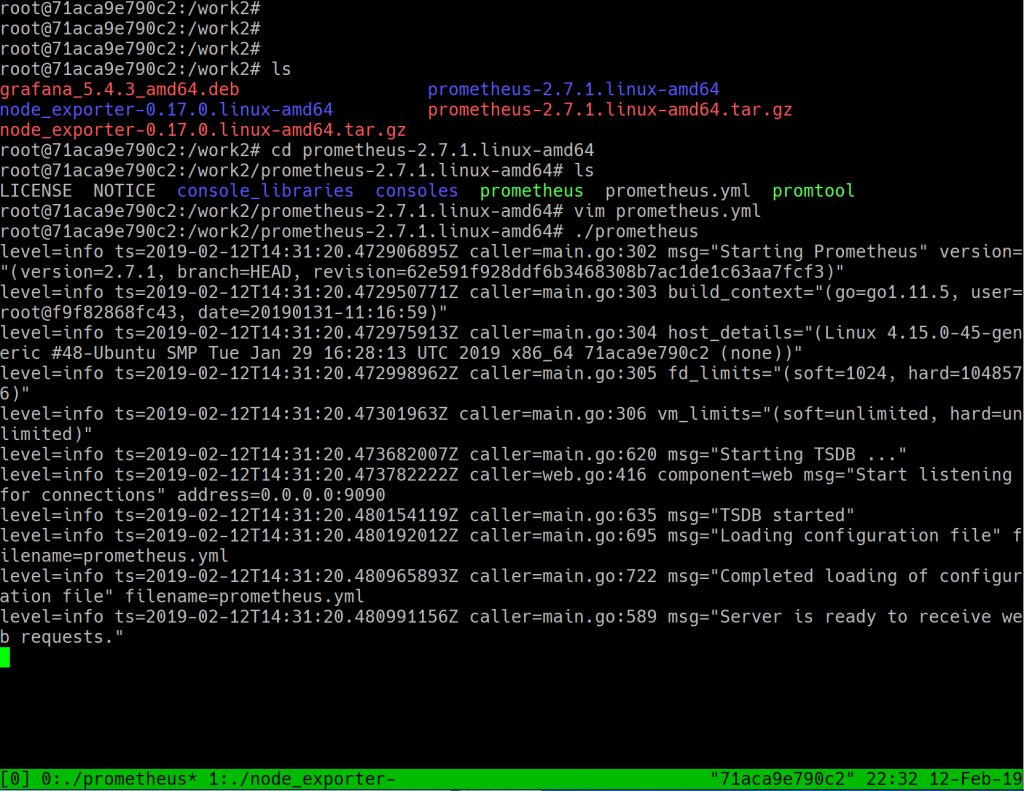
然後連到 http://<docker machine ip>:9090 就可以看到 Prometheus 的畫面
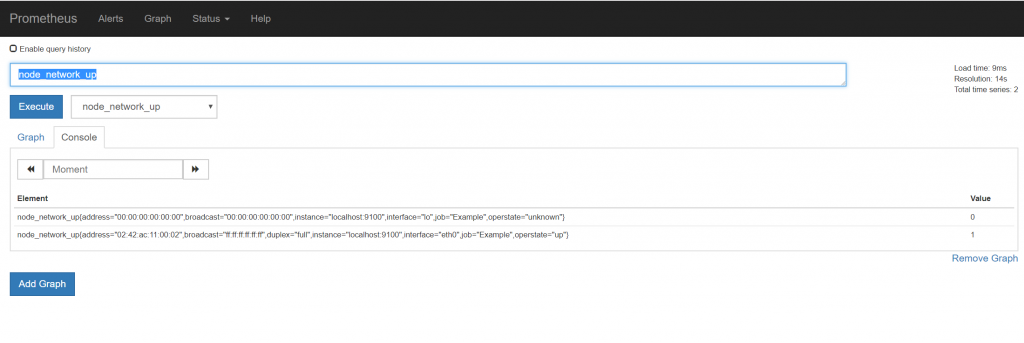
這時在 Execute 旁邊的下拉式選單選一個 node_* 出來看看是不是有成功連到 node_explorer ,像我是選 node_network_up
連到 Grafana
到這邊就完成了 1/3 ,看吧很簡單吧
接下來是連到 Grafana 的介面,連到 http://<docker machine ip>:3000
Username/Password: admin/admin
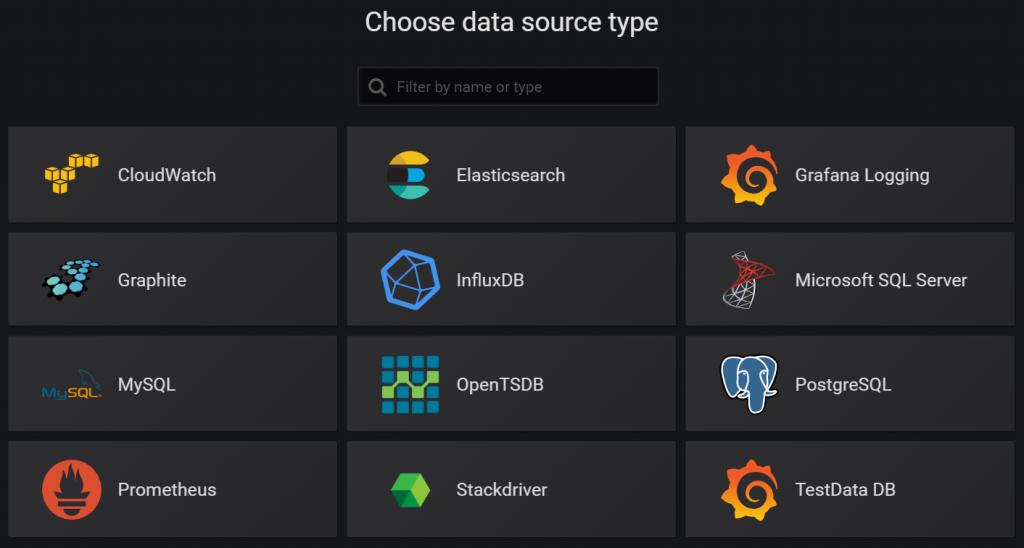
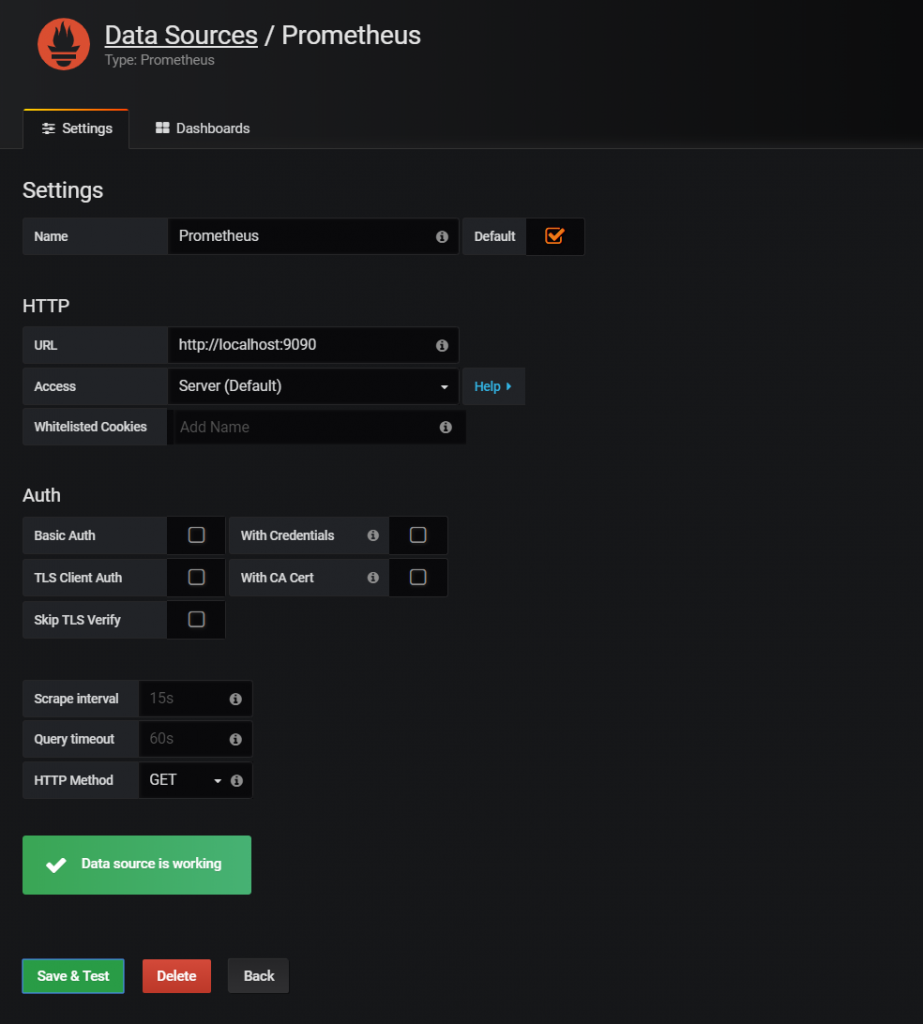
一進去選 Add data source 選 Prometheus
在 URL 處填上 http://localhost:9090,然後選 Save & Test
如果一切正常就會顯示 Data Source is working
在 Dashboard -> Manage -> Import 的 Grafana dashboard 上輸入 159 (ref url)
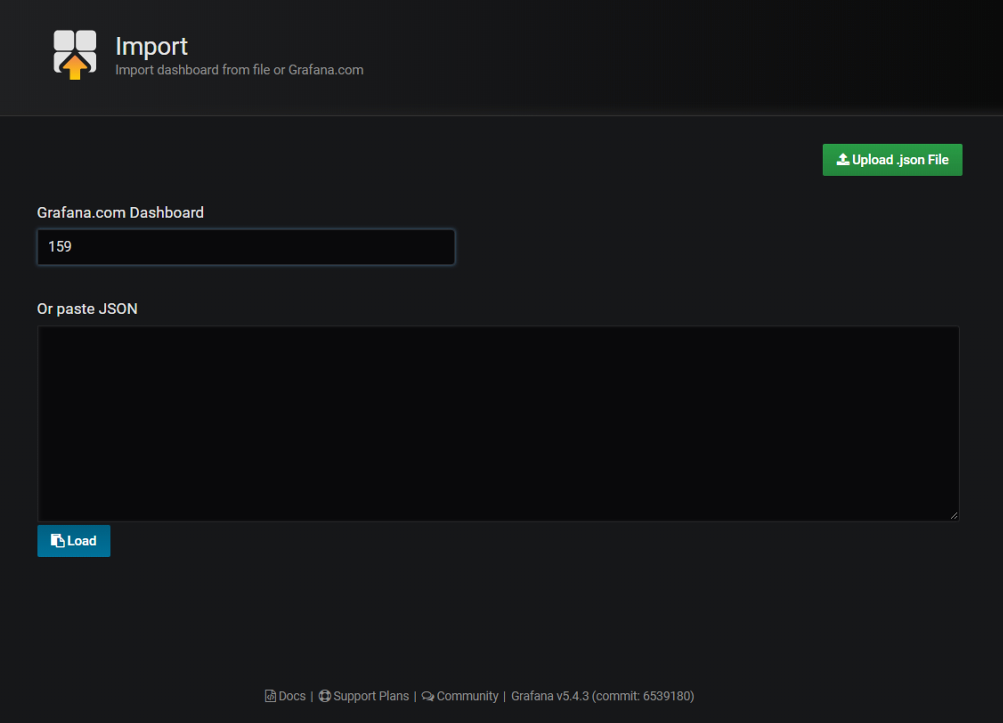
在 Prometheus 那一欄選 Prometheus
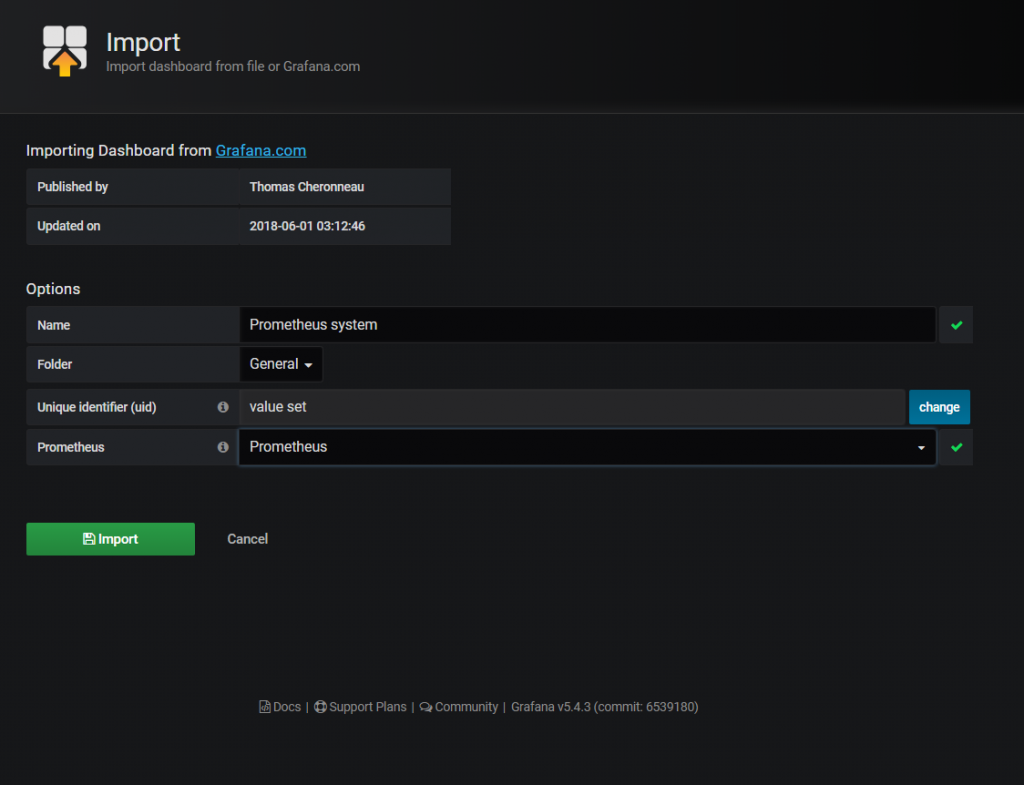
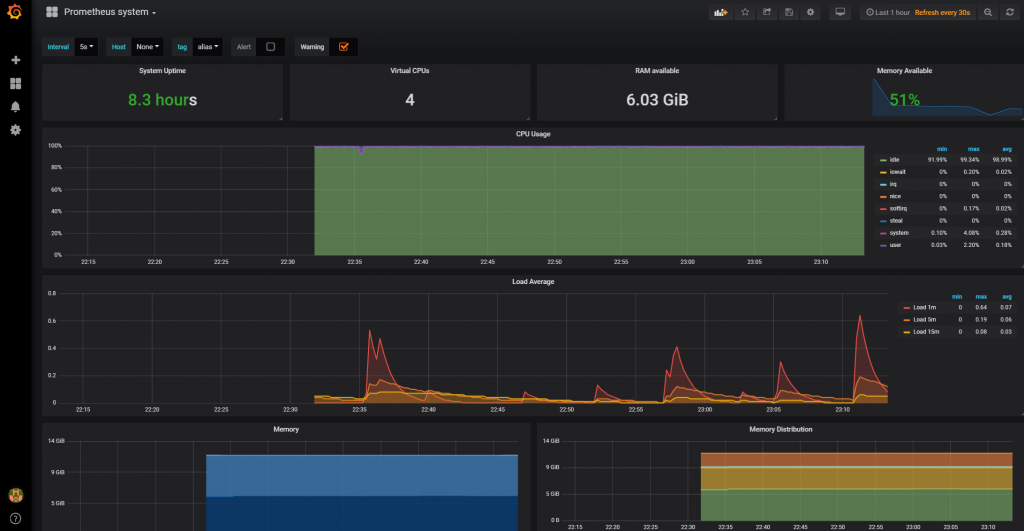
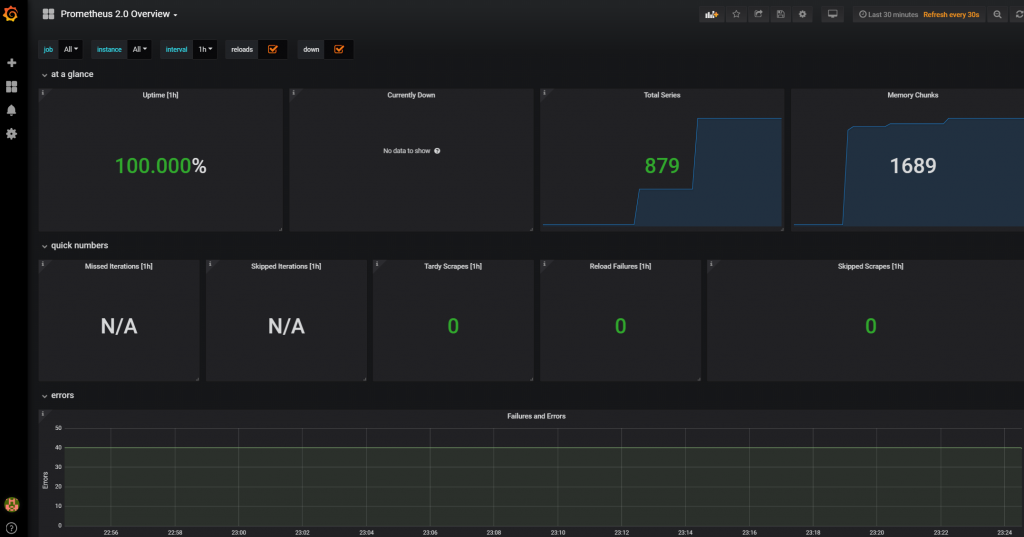
如果一切 OK 的話就會看到 Grafana 接到 Prometheus 的畫面,看吧,很簡單吧
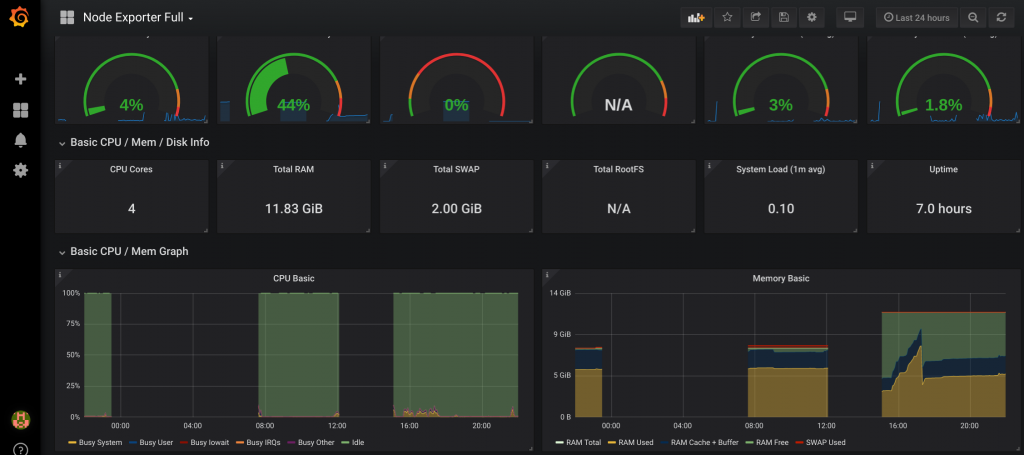
如果你看到下面這一個畫面表示已經完成了 2/3 了
也可以接上其他的範例,像是 Dashboard 3662
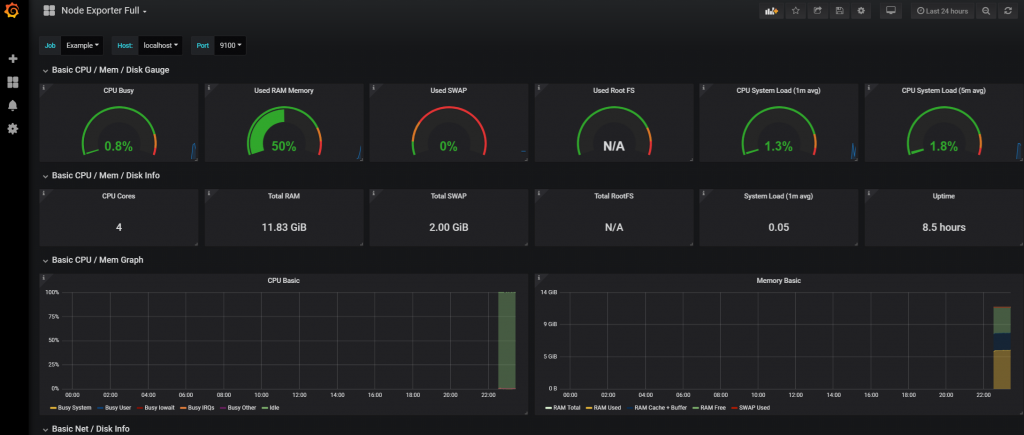
或是專屬 node explorer 的 Dashboard 1860
請安裝 node explorer 的 Dash board ,接下來會從這個範例改出自己要的東西
接上自己寫的 Python Client
請參考Prometheus instrumentation library for Python applications
這個網頁的內容
不過記得不要用 Ubuntu 內建的 prometheus python client ,可能會有問題,至少我用的 Ubuntu 18.04 LTS 內建的會有問題。
在 Docker 內預設是沒有 pip 的,所以要先裝 pip 再裝 prometheus python client
$ apt -f install python3-pip
$ pip3 install prometheus_client
這邊還是要測試一下要怎麼將自己的指標接到 Grafana
不過相信會翻到這邊表示一定對 Prometheus / Grafana 有一點點瞭解了,Prometheus 是 TimeSeries 型的 DBMS ,非常適合用在有時間序列的資料收集。有些類似 rrdtool 的 DB ,但是 rrdtool 是會 round-robin ,比較適合做不需要細部資料的圖表。
Prometheus 收集資料的時候都會加上 label ,其中有二個 label 會自動加上去
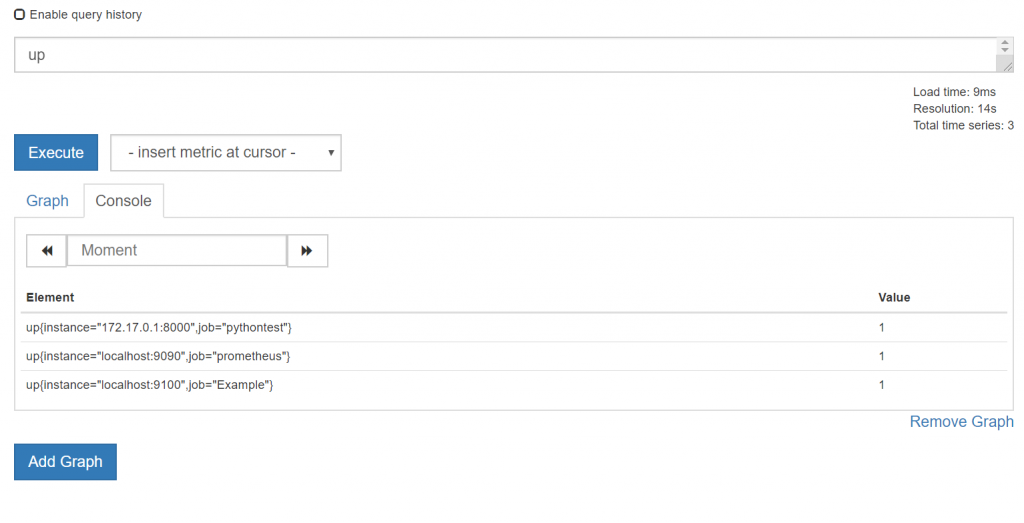
instance 和 job,例如在 Prometheus 的 query 視窗下 up 的時候就會出現了 (JOBS AND INSTANCES)
instance 指的是 IP, job 就是這個 ip 上跑的是什麼服務的名稱,往上捲就可以看到這兩個值我們都設定在 prometheus.yml 內了
Prometheus 原來的設計是讓 Prometheus 自動去各個 client fetch 資料,如果有主動 push 資料的需求,要使用 pushgateway 。
不過因為我們是用 python client ,所以 instance 和 job 是一樣的,如果 python client 是一個自己寫的類似 gateway 的功能,這時候預設的這兩個 label 就不適合了。這時可以自己多加一個 label。
下圖可以看到 query 後多了 instance 和 job
接下來就要寫個測試用的 code,剛剛 prometheus python client 網站內就有一個很好的範例,這邊假設你看過了 prometheus python client ,所以我就不介紹資料型別了(我好懶),我們用網站範例改了一下出了一下噁心的 code
from prometheus_client import start_http_server, Summary
from prometheus_client import Info
from prometheus_client import Counter
from prometheus_client import Gauge
import random
import time

# Create a metric to track time spent and requests made.
REQUEST_TIME = Summary('request_processing_seconds', 'Time spent processing request')
TEST_ITEM  = Counter('test_item', 'for test purpose',["host"])
TEST2_ITEM = Gauge('test2_item', 'for test gauge',["host"])


REQUEST_COUNT = Counter(
    'request_count', 'App Request Count',
    ['app_name', 'method', 'endpoint', 'http_status']
)
REQUEST_COUNT.labels('test_app', 1, 2, 404).inc()


TEST_ITEM.labels("1").inc()
TEST_ITEM.labels("2").inc()
TEST_ITEM.labels("2").inc()
i = Info('my_build_version', 'Description of info')
i.info({'version': '1.2.3', 'buildhost': 'foo@bar'})

# Decorate function with metric.
@REQUEST_TIME.time()
def process_request(t):
    """A dummy function that takes some time."""
    time.sleep(t)
if __name__ == '__main__':
    # Start up the server to expose the metrics.
    start_http_server(8000)
    # Generate some requests.
    while True:
        TEST2_ITEM.labels("1").set(random.random()*100)
        TEST2_ITEM.labels("2").set(random.random()*100)
        process_request(random.random())
這個範例內,我們在 Gauge 和 Counter 後面都加上了label host,加上參數之後,後面要 Update 這筆資料的時候就要加上 labels() 這個參數一起更新資料.
如果有 4 個 label ,那 labels 參數內就要放上 4 個,最後是這個變數的值
將這個存檔(ex: test.py) 然後在 docker 內執行它
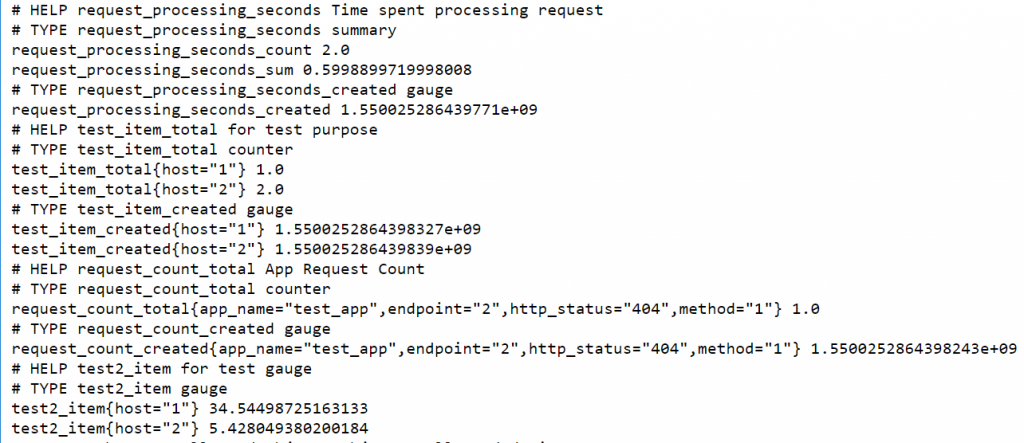
$ python3 test.py 執行時什麼都沒有,可以的話可以連到 http://<docker machine ip>:8000 看輸出的結果
這邊很清楚就可以看到有加上 label 和沒有加上 label 的差別
request_processing_seconds 是沒有 label 的
test_item 和 request_count 是有 label 的
但是為什麼沒有 instance 和 job 呢?那是 prometheus 加上去的
這時就可以連到 prometheus gui 查詢 test2_item ,就可以看到加上了 instance 和 job
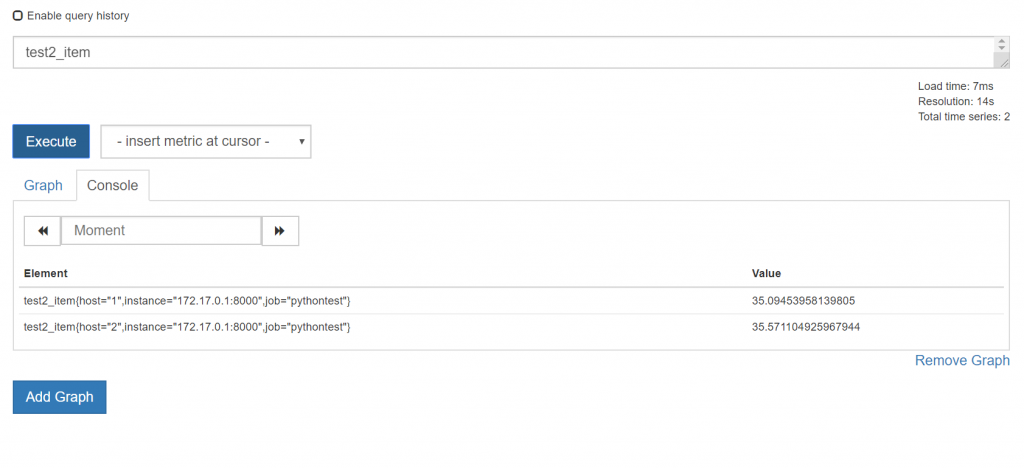
就是這樣,很簡單吧
最後一個步驟就可以大功告成了
在 Grafana 顯示自定的資料
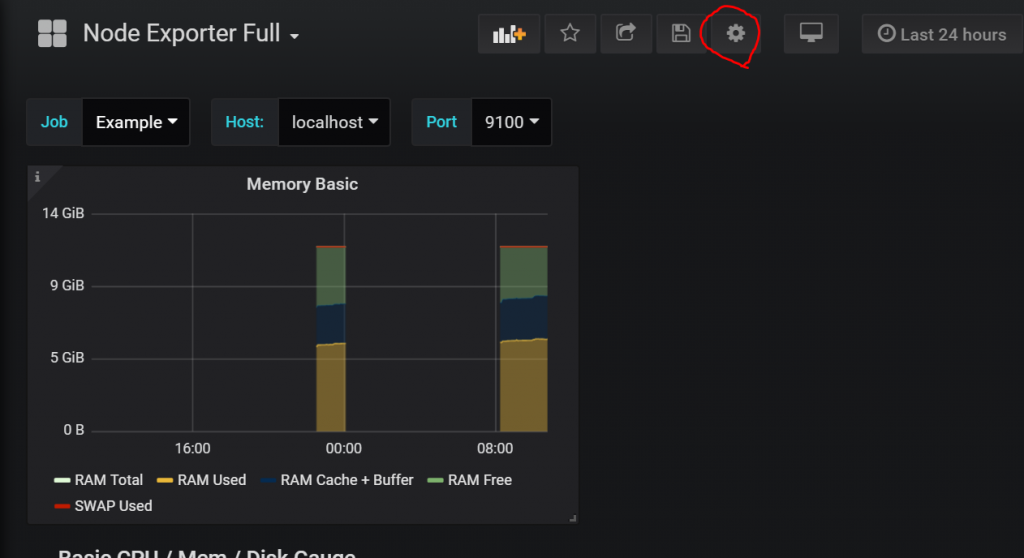
連到 Grafana ,在剛剛新加的 Node Exporter Full Dashboard 上,選 Memory Basic -> More -> Duplicate ,等一下我們要拿這個做範例,Duplicate 後,他名稱不會改,沒關係,拉到最上面就好
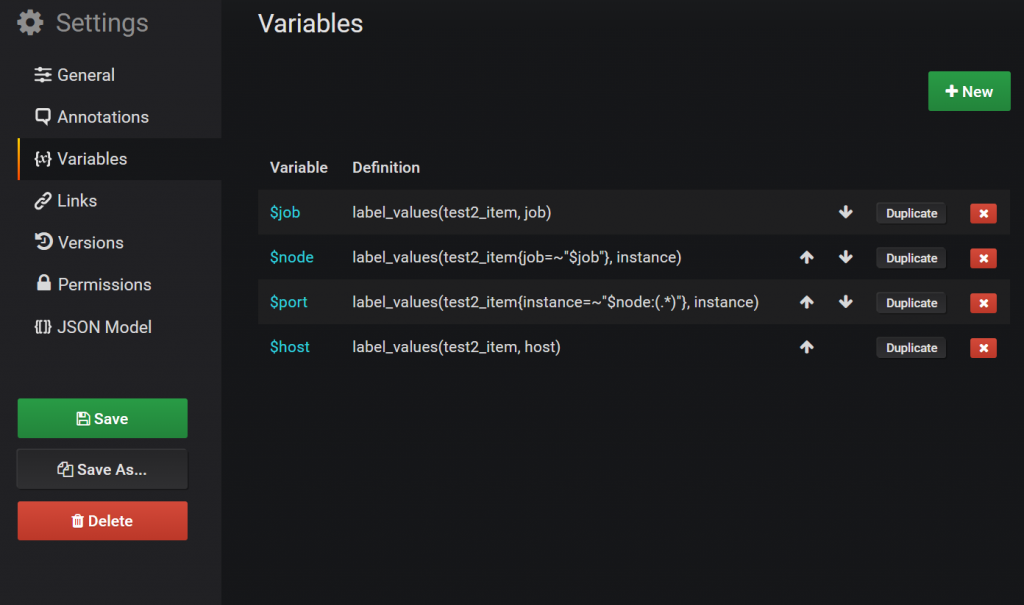
這時選紅圈的地方,這是設定 dashboard 的地方,點進去選 Variables
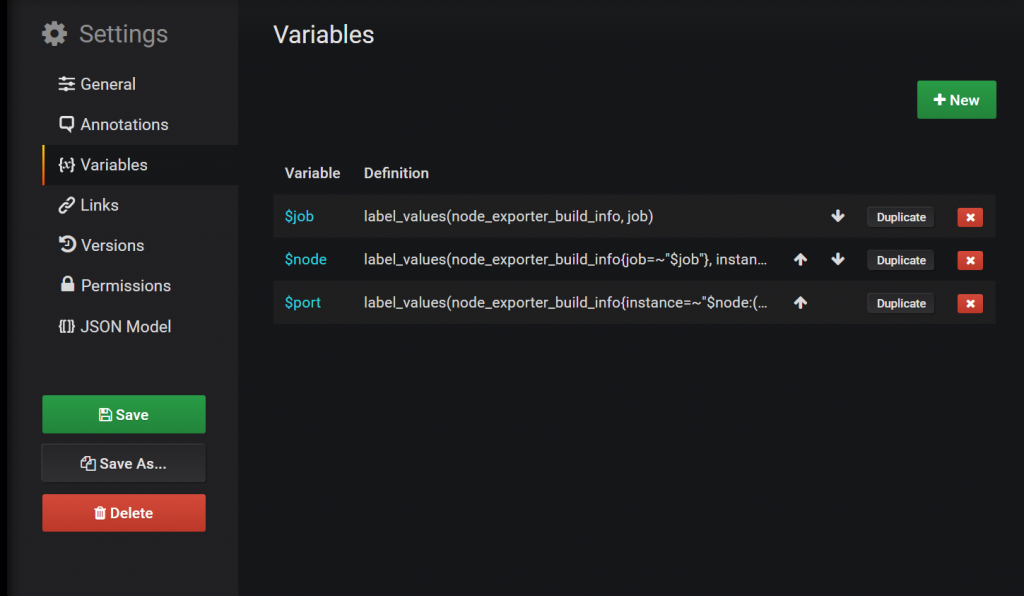
這邊我們直接 duplicate $job 那個選項,會生出 $copy_of_job,然後修改 $copy_of_job
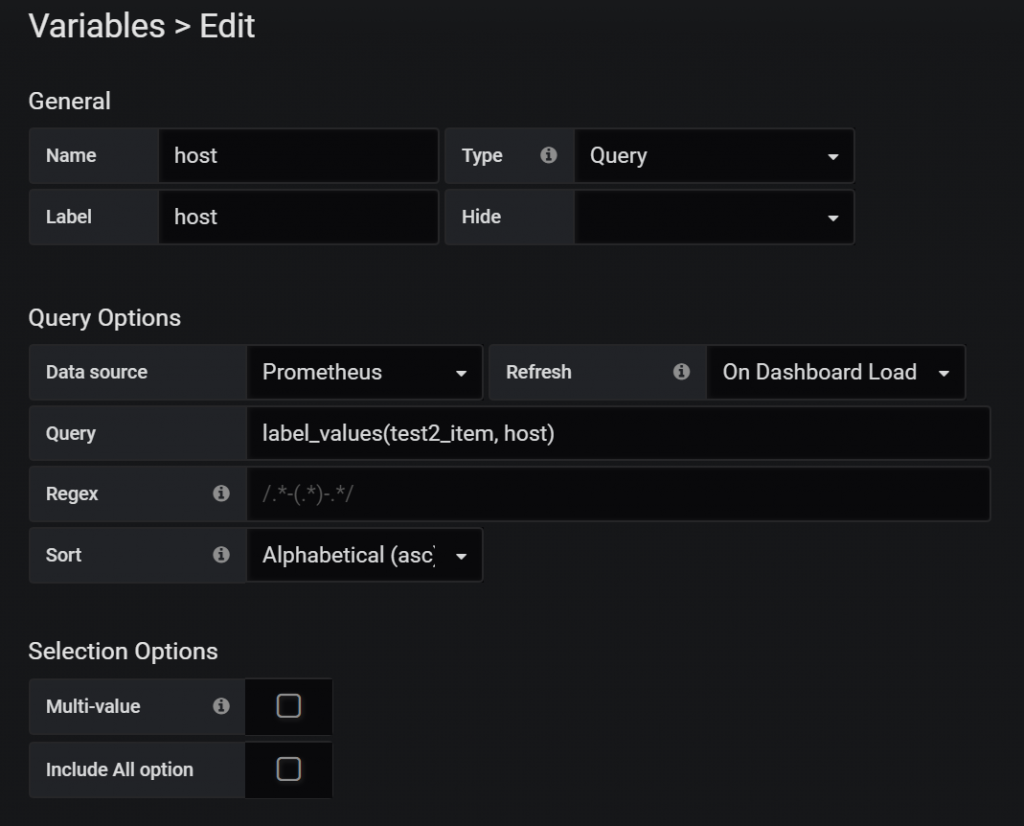
Name 和 Label 都填 Host
Query 填 “label_values(test2_item, host)” 改完之後選 Update
順手其他的node_exporter_build_info變數也改成test2_item
記得按 Save 存檔
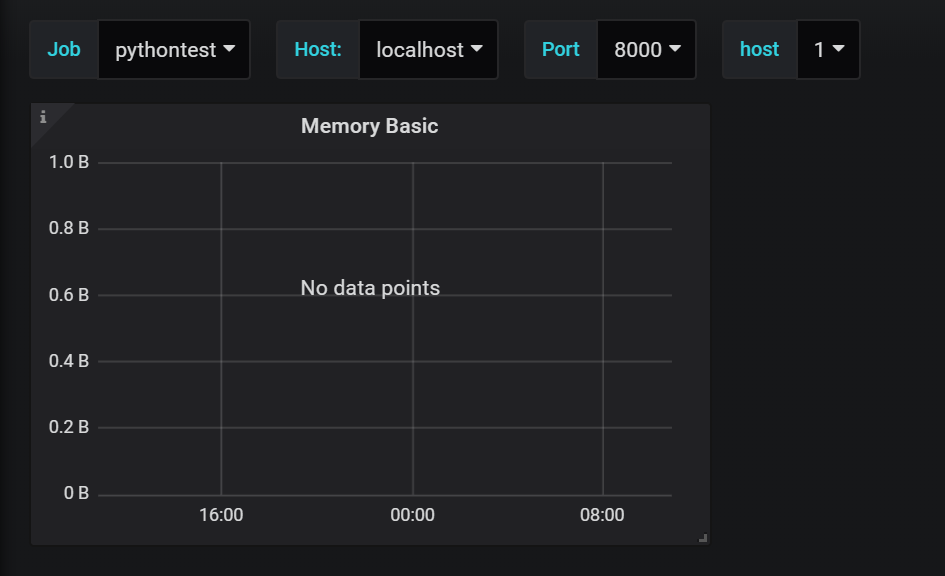
這時候上面的選單可以重選了,如果一切順利就會只有 pythontest 而 host 只有 1 和 2 的選項
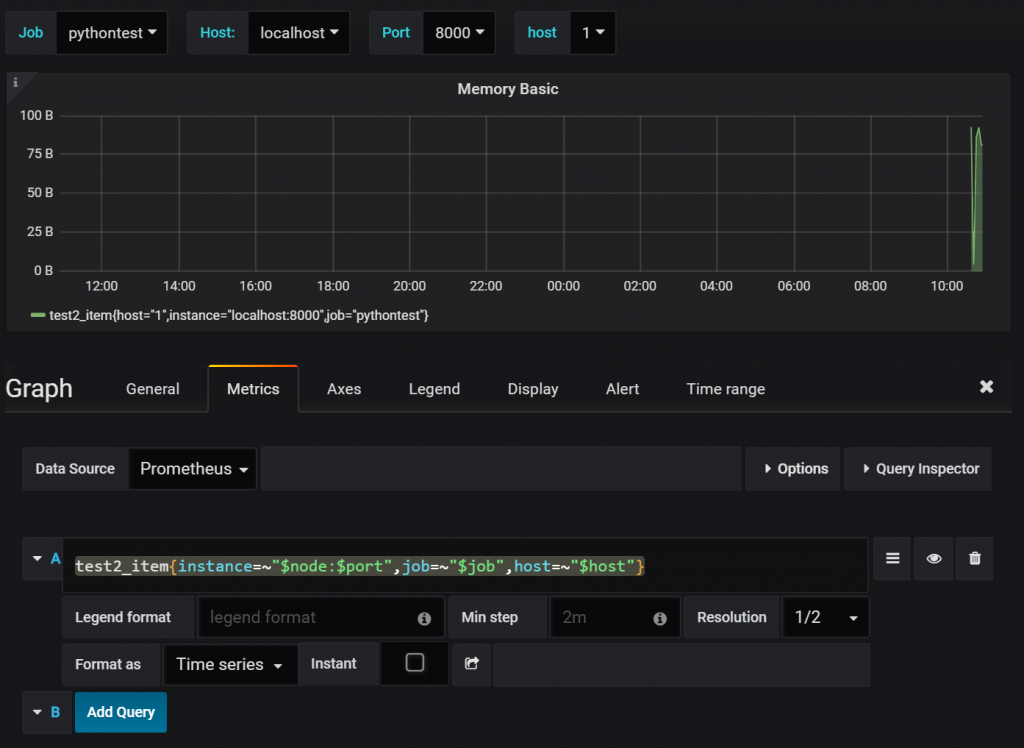
這時選 Memory Basic -> Edit
進去之後,砍掉其他的值,留下一個,改成
test2_item{instance=~”$node:$port”,job=~”$job”,host=~”$host”}
如果順利的話,值就會跑出來了,接下來就隨便你玩了
像是 General-> Title
Legend -> Min Max Avg Current 都選起來
也可以在 host 上選 2 就會有不同的結果
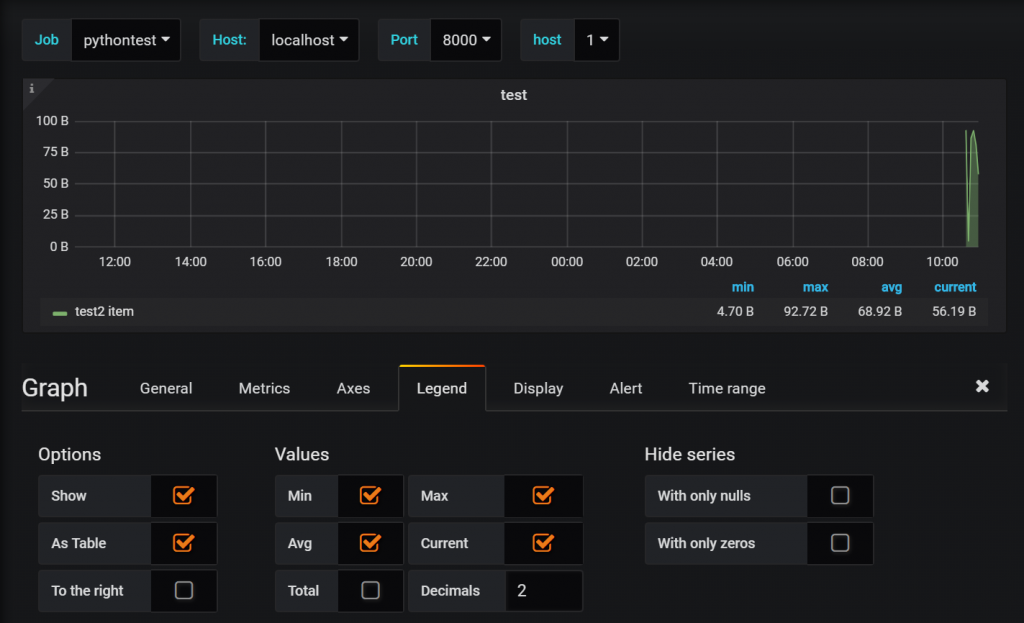
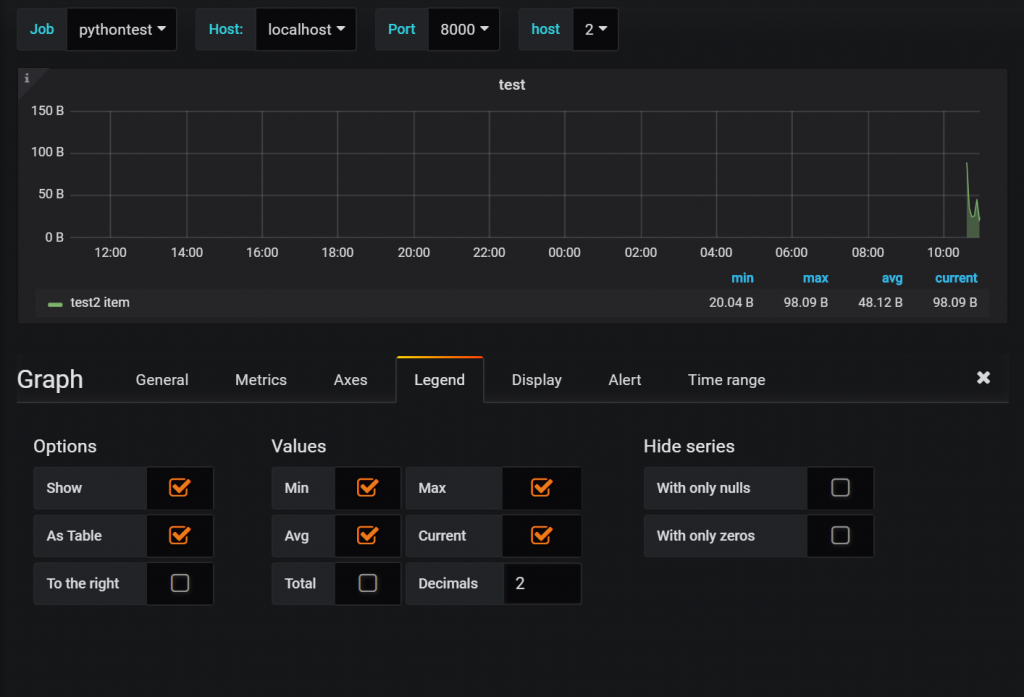
別忘記最後存檔
這樣就可以了,看吧,很簡單吧
ref
Monitoring Your Synchronous Python Web Applications Using Prometheus
WRITING EXPORTERS
使用Node Exporter采集主机数据

發佈留言